Consultation

SMART KPI & Advanced Reporting for D365FO Apps is a powerful analytics and reporting extension designed to enhance the native capabilities of Microsoft Dynamics 365 Finance and Operations Applications, including Microsoft Dynamics 365 Finance and Microsoft Dynamics 365 Supply Chain Management. It enables users to quickly access a comprehensive set of reports, KPIs, and dashboards directly within the D365FO Apps environment, supporting fast data-driven management.

The solution delivers ready-to-use analytical content built on proven data models tailored for Microsoft Dynamics 365 Finance and Microsoft Dynamics 365 Supply Chain Management. It currently supports key functional areas such as Finance, Sales, Procurement, Warehousing, and additional functional areas planned for future updates.

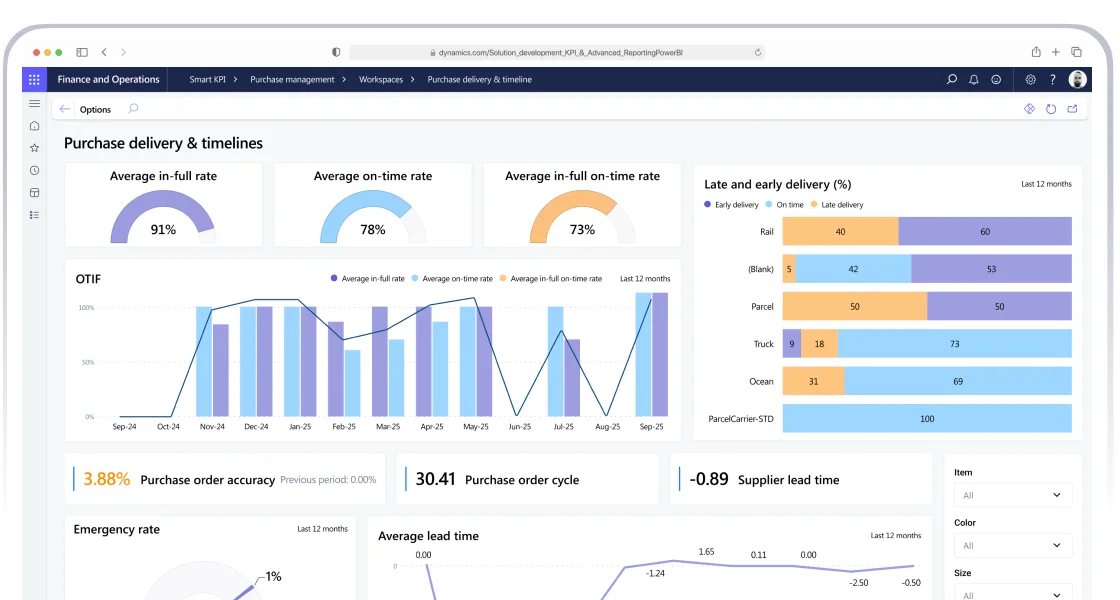
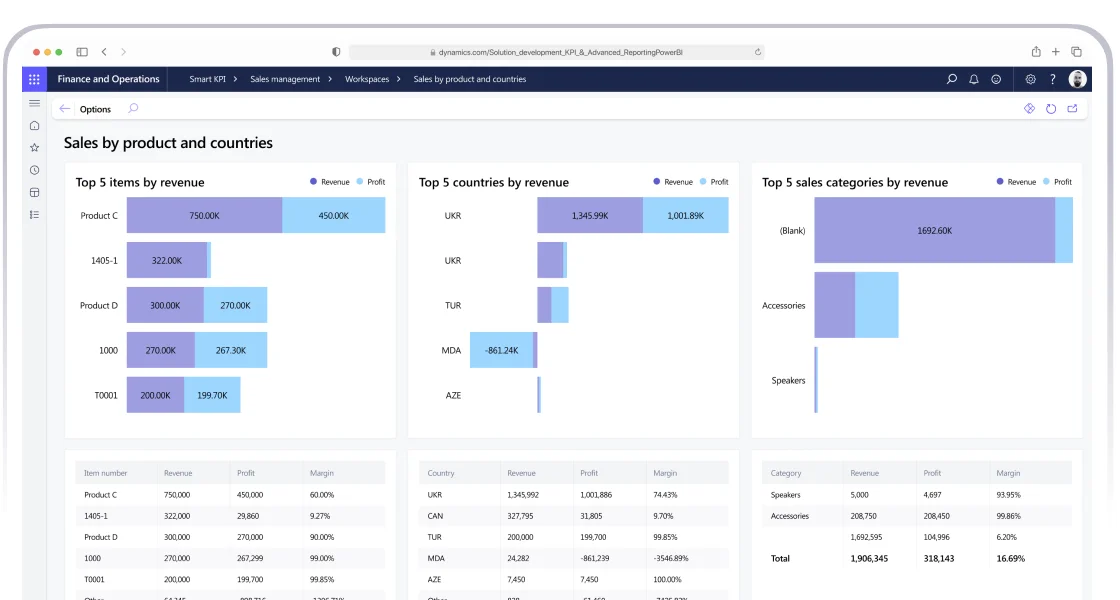
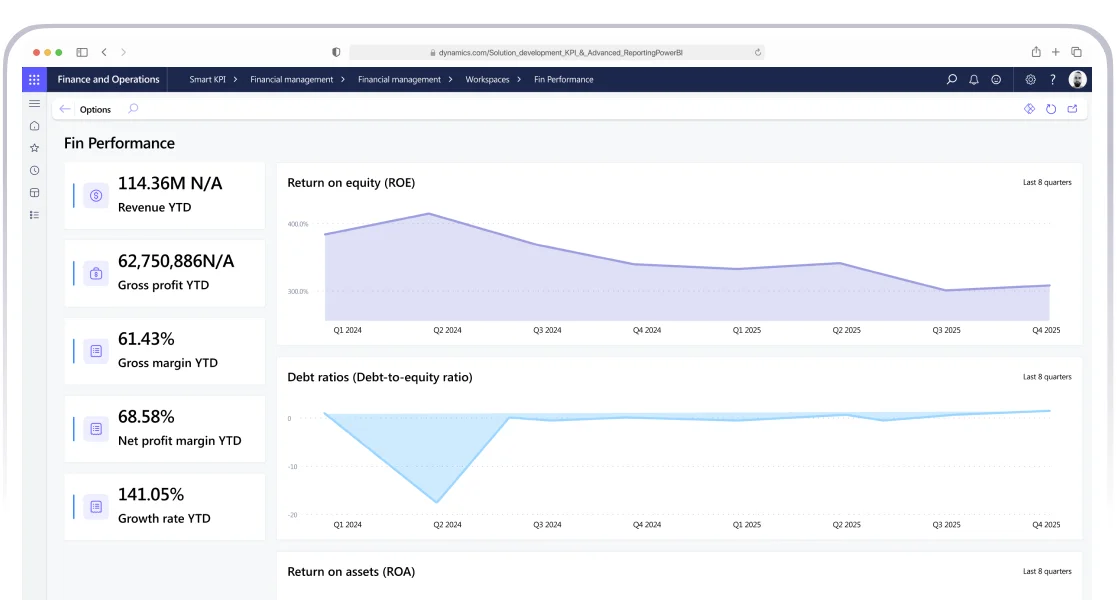
SMART KPI & Advanced Reporting provides both real-time data snapshots for operational decision-making and historical trend analysis to support tactical and strategic planning. The built-in dashboards and workspaces are powered by embedded Power BI technology, offering rich visualizations and user-friendly navigation.

This solution goes beyond high-level financial overviews — it delivers detailed insights into areas like monthly performance, accounts receivable and payable tracking, and operational efficiency. In the supply chain area, the system provides access to base and extended KPIs, reporting, and dashboards, helping users maintain visibility over end-to-end processes and respond quickly to changing business conditions.

SMART KPI & Advanced Reporting can be seamlessly integrated into new Microsoft Dynamics 365 Finance and Operations Applications implementations or deployed to existing, customized environments to enhance decision-making capabilities without disrupting core operations.

SMART KPI & Advanced Reporting Features

A set of KPIs for tracking process efficiency

The solution includes a set of key performance indicators tailored to core business processes. These KPIs help monitor efficiency, identify bottlenecks, and evaluate performance trends, giving users immediate insight into operational health of company.

Dashboards and reports reflecting key process insights for quick decision-making

Interactive dashboards and pre-configured reports present vital metrics and trends in a clear and visual format. This enables managers and decision-makers to quickly assess situations, spot deviations, and take timely action based on reliable data.

Data remains within the Microsoft D365FO Apps ecosystem without additional integrations

The SMART KPI & Advanced Reporting solution is fully embedded in the D365FO environment, using native tools such as Power BI Embedded, as well as standard and developed data entities. This eliminates the need for external systems or complex integrations, ensuring seamless access, consistent security, and simplified maintenance.

Adaptable to specific customer needs

Although the SMART KPI & Advanced Reporting solution offers ready-made content, it is designed for flexibility. Users can use all current forms and reports management capabilities of the D365FO Apps system, such as filtering, sorting, hiding, and adding fields. It is also possible to customize the solution according to principles similar to customization of the standard functionality of the system, which will allow you to add your own KPIs and expand reports to meet unique business requirements or industry indicators.

SMART KPI & Advanced Reporting Components

  • Procurement
  • Sales
  • WMS
  • Finance
KPI / Metrics+
25
Purchase orders by status
Shows the number of purchase orders with current status (Created, Confirmed, Received, etc).
On-hold agreements
Shows how many agreements have been moved to the on hold status.
Purchase requisitions by status
Shows the number of purchase requisitions by status.
Average lead time
Measures the overall average time between placing a purchase order and receiving the goods.
Vendor contracted (%)
Shows what percentage of vendors have effective (active) purchase agreements.
Purchase orders in each status by employee (%)
Shows the number of purchase orders with current status by purchasing managers (employees).
Purchase agreements by status
Shows information on purchase agreements by statuses.
Average in-full rate
Measures the average percentage of purchase orders that were fulfilled in full, without shortages.
Late and early delivery (%)
The Late and early delivery (%) KPI measures the percentage of deliveries that deviate from the scheduled delivery date — both late and early.
Total cost per vendor
Total spend per vendor over a period.
Planned vs Actual
Shows information about the timeliness and completeness of deliveries against the planned schedule.
Purchase agreements by employee
Shows information on the current statuses of purchase agreements by employee.
Average on-time rate
Measures the average percentage of orders delivered exactly on time — neither late nor early.
Emergency rate
Measures the percentage of urgent (unplanned or last-minute) purchase orders out of the total.
Total cost per order
Measures the total cost incurred per individual purchase order. Useful for analyzing cost efficiency per transaction.
Agreements to be effective
Shows how many purchase agreements should be transferred to the effective (active) status on the current date.
Approved purchase requisitions
Indicates how many purchase requisitions have passed the approval workflow and are ready to be processed further.
OTIF
Measures the percentage of deliveries that were completed on time and in full. That means: -the delivery occurred on the scheduled date, -the full quantity ordered was received without shortages.
Purchase order accuracy
Reflects how accurately purchase orders match what was actually delivered.
Average monthly amount spent
The average amount spent on procurement each month.
Agreements to be closed
Shows how many purchase agreements should be transferred to the closed status on the current date.
Closed purchase requisitions
Shows the number of purchase requisitions closed as of the date.
Supplier lead time (SLT)
Measures the average time it takes a supplier to deliver goods from the moment a purchase order is placed.
Purchase order cycle
Measures the average time from creating a purchase order to its full execution.
Other
Reports
1
Extended purchase orders data for reporting
A separate interface form has been developed that consolidates all key procurement parameters in one place, with the ability to export data to a file (Excel).
Dashboards
2
Daily operations
Purchase performance
KPI / Metrics
9
Average sales cycle length
Measures the average time it takes to convert a sales lead, opportunity or quotation into a shipped sales order.
Average sales value
Measures the average sales amount per invoice, offering insights into the typical financial value associated with each billing transaction.
Customer acquisition cost
Measures the average cost of acquiring a new customer. It reflects how much your organization is spending on marketing and sales to convert leads into paying customers.
Customer churn rate
Measures the percentage of lost customers, the number of new and lost customers.
Customer lifetime value
Represents the total revenue a business expects to earn from a customer throughout their entire relationship with the company.
OTIF
Measures the percentage of customer orders delivered both on time and in full – meaning the correct products, quantities, and delivery date were met.
Revenue and profit per product
Measures revenue, profit and margin percentage for each product.
Sales growth and target
Measures the comparison of actual sales figures with predetermined sales targets.
Sales by country
Measures revenue, profit and margin percentage for each сountry.
Reports
2
Quote and orders
Provides a detailed overview of sales quotations and their transition into confirmed sales orders.
Extended sales
Іs a detailed, line-level reporting tool that provides comprehensive visibility into sales order processing, fulfillment, pricing, customer segmentation, and delivery performance.
Dashboards
5
Sales cycle
Sales by employees
Daily operations
Sales by products and countries
Sales performance
KPI / Metrics
14
Inventory turnover
Measures how many times a company sells and replaces its inventory.
Warehouse return rate
Measures the percentage of products shipped from the warehouse that were returned to warehouse.
Pallet life cycle
Shows the average number of days a pallet stays in the warehouse.
Line to dock time
Measures the average time taken to move finished goods from the production to the shipping dock.
Inventory accuracy
Measures how closely the recorded inventory (in a system) matches the actual physical inventory.
Receipt quality ratio
Shows the ratio of items that passed quality control to the total number of items received.
Stock to dock time
Measures the average time taken to execute the movement of picked goods from storage to the shipping dock area.
Warehouse throughput by weight
Shows the dynamics of the total weight of shipped goods, average and maximum monthly weight.
Deadstock
Measures the amount of inventory that cannot be sold or used relative to the total inventory.
Load unevenness factor
Shows the deviation of the current (month) warehouse workload from the maximum workload level.
Dock to stock time
Measures the average time required to complete the movement of received goods from the inbound docks to storage
Picking ratio
Measures how accurately and completely warehouse staff pick items compared to what was planned.
Throughput per pallet
Shows the average number of operations per license plates.
Line to stock time
Measures the average time it takes for finished goods to move from the production line to inventory storage (stock).
Reports
8
On-hand with picked items
Provides a comprehensive and detailed view of stock levels, including picked (but not yet shipped) inventory.
Inventory turnover
Provides detailed insights into inventory turnover, i.e. how frequently stock is cycled through a warehouse.
Shipment process tracking
Offers real-time insight into the status and progress of outbound shipments. It tracks each item’s movement through the order fulfillment process, from reservation and picking to shipping.
Warehouse utilization
Provides a detailed analysis of how warehouse storage space is being used.
On-hand on date
Provides a snapshot of inventory levels as of a specific historical date, including detailed dimensional tracking and cost valuation.
Purchase process tracking
Provides end-to-end visibility into the status and progress of purchase orders. It tracks ordered goods from the created purchase to receipt, including quantities, defects, shortages, and storage.
Production process tracking
Povides detailed, real-time insights into the progress and output of production orders. It tracks the flow of items from production through reporting as finished, including quantities involved in cross-docking, pallet movements, and any reversals.
Works detailed report
Provides granular visibility into every warehouse work line, capturing operational details from work creation through execution and closure.
Dashboards
7
Inventory cost
Warehouse utilization
Production line control
Warehouse works
Availability of stocks
Plan vs Actual analysis
Expiration date control
KPI / Metrics
16
Gross profit
It is a company's remaining profit after deducting the costs associated with producing and selling its products or services. It's also known as sales profit or gross income.
Debit ratios (Debt-to-equity ratios)
Ratio is used to evaluate a company's financial leverage.
Net working capital
The difference between a company's current assets and current liabilities.
Gross margin
It is the percentage of a company's revenue that's retained after direct expenses such as labor and materials have been subtracted.
Liquidity ratios (Current ratio and quick ratio)
Liquidity ratios are a class of financial metrics used to determine a debtor's ability to pay off current debt obligations without raising external capital.
DPO
Days payable outstanding (DPO) is a working capital ratio that measures the average number of days it takes a company to pay its invoices and bills to its creditors – including vendors, third-party suppliers or creditors.
Net profit margin
A measure of how much profit (or net income) a business generates.
Current ratio
The current ratio is a common liquidity ratio used to judge whether or not a company can pay current obligations.
DSO
Days sales outstanding (DSO) is the average number of days it takes a company to receive payment for a sale.
Growth rate (%)
Company growth rate refers to the rate at which a company's revenue, profit, customer base, or other performance metrics increase over time.
Quick ratio
The quick ratio measures a company's ability to immediately meet its short-term obligations using its most liquid assets.
DIO
Days inventory outstanding (DIO) is a working capital management ratio that measures the average number of days that a company holds inventory for before turning it into sales.
Return on assets (ROA)
Financial ratio that indicates how profitable a company is relative to its total assets.
Cash ratio
A company's cash ratio is an indicator of its liquidity. That is, it estimates the company's ability to meet its short-term obligations.
CCC
The cash conversion cycle (CCC) is a metric that measures the amount of time it takes for a company to sell its inventory, collect receivables, and pay its bills.
Return on equity (ROE)
The measure of financial performance calculated by dividing net income by shareholders' equity.
Dashboards
2
Accounts payable and acounts receivable performance dashboard
Financial performance dashboard

Implementation results for business

Increased Transparency and Manageability

Single source of truth – data is collected from various functional areas and presented centrally.

Process visibility – it’s easier to identify bottlenecks, deviations, and inefficiencies.

Time and Resource Savings

Reduced manual work – routine data collection and processing tasks are minimized.

Fast report generation – reports are produced in minutes, not hours or days.

Better Decision-Making Support

Real-time data – management decisions are based on up-to-date, accurate information.

Live analytics – allows tracking of KPIs, trends and deviations.

Improved Accuracy and Fewer Errors

Minimized human errors – reduces risks from manual data entry.

Automated validation – systems can detect anomalies and inconsistencies.

Flexible Analysis and Visualization

Interactive dashboards – users can explore data independently without IT help.

Custom filters and drill-down – allows going from overview to detailed insights.

Better Cross-Departmental Collaboration

Standardized metrics – KPIs are unified and understood across departments.

Aligned goals – everyone can see how their performance contributes to overall business results.

Security and Access Control

Role-based access – users see only the data relevant to their role.

Audit trails – track who changed what and when.

Who might be interested in this product

SMART KPI & Advanced Reporting can be of interest and serves as an essential tool for professionals working in companies across all types of industries and involved in data processing within the areas of financial management, supply chain management, and warehouse operations.

It is particularly valuable for professionals operating at the following management levels:

CEO, CFO, COO, CLO, CPO, CTO, etc.

C-Level

  • Instant access to key indicators (turnover, revenue, profit, debt)
  • Accelerated management decision-making based on current data analysis
  • Data remains within the Microsoft ecosystem (D365FO)
FP&A

Financial Planning & Analytics

  • Automation of plan-vs-actual analysis
  • Analysis by departments, item groups, and financial responsibility centers
  • Quick identification of deviations and focus on risk areas
  • Reduced time for data collection used in corporate reporting
Functional Managers

Purchasing, Sales, Warehouse, Logistics

  • Detailed KPI breakdown by department and employee
  • Prompt identification of deviations from plans and KPIs
  • Reduced reliance on analysts and IT
  • Support for decision-making at the operational level
  • Daily operational analysis with filtering options
Line Managers

Shifts, Quality, Planning, and Dispatch Service

  • Visual representation of daily operations status
  • Focus on deviations: defects, anomalies in specific zones
  • Tools to motivate teams to meet KPI targets (employee dashboards)
  • Simple and clear interface, including a control tower approach
Business Analysts

Business Analysts

  • Flexible analysis tools: data export, filters, and sorting
  • Direct access to ERP data (no copies or external integrations)
  • Ability to upload transaction-level data and create custom analytics
  • Customizable dashboards and reports
Auditors

Auditors

  • Ability to trace data back to source documents in the ERP
  • Export of complete transaction data for any specified period
  • Support for internal and external audits
  • Reduced time spent on checks and elimination of manual verification

Industries

Manufacturing

Retail & HoReCa

Distribution & Logistics

Financial Services

Construction & Real Estate

Energy, Oil & Gas, Mining

Professional Services

Pharma & Healthcare

Agriculture & Food Processing

Budgeting CTA

If you have any questions, you can request a consultation or receive additional materials

They trust us

BDOIkeadtekbrocardJTIMitsubishi Motors

About SMART business

We connect business processes, lead Microsoft technology and AI to help our customers succeed fast and efficiently

SMART business is a leading Microsoft partner in the development, implementation and support of modern ERP, CRM, HRM systems, the development of Microsoft cloud services and solutions based on predictive analytics and ML.


Holding 6 out of 6 Microsoft Solutions Partner Designations, we use only the best practices and the latest tools to facilitate rapid achievement of our customers’ strategic business goals.

successful years
in the IT market
customers
worldwide
specialists certified
by Microsoft
countries, cross-industry expertise
6 out of 6 Microsoft Solutions Partner Designations
mail